Mortgage repayment maps: what renters can—and cannot—learn from them
The ONS mortgage map models average purchase repayments, not rents or landlords’ actual loans. Here is how renters can interpret it, avoid misleading comparisons and identify a possible tenant FAQ clarification.
In this article
A mortgage repayment map can help you explore a possible move from renting to buying. It cannot tell you what your rent should be, what your landlord pays, or whether buying a particular home would be affordable for you. Those are important limits when interpreting the Office for National Statistics’ mortgage calculator. Source: ONS
Evidence date: the supplied ONS article displays a publication date of 8 March 2023 and was retrieved on 7 October 2026. Retrieval does not establish that its underlying figures are current. This article explains the calculator’s documented method, not October 2026 mortgage costs or a new change in tenancy law. Source: ONS
What the map actually measures
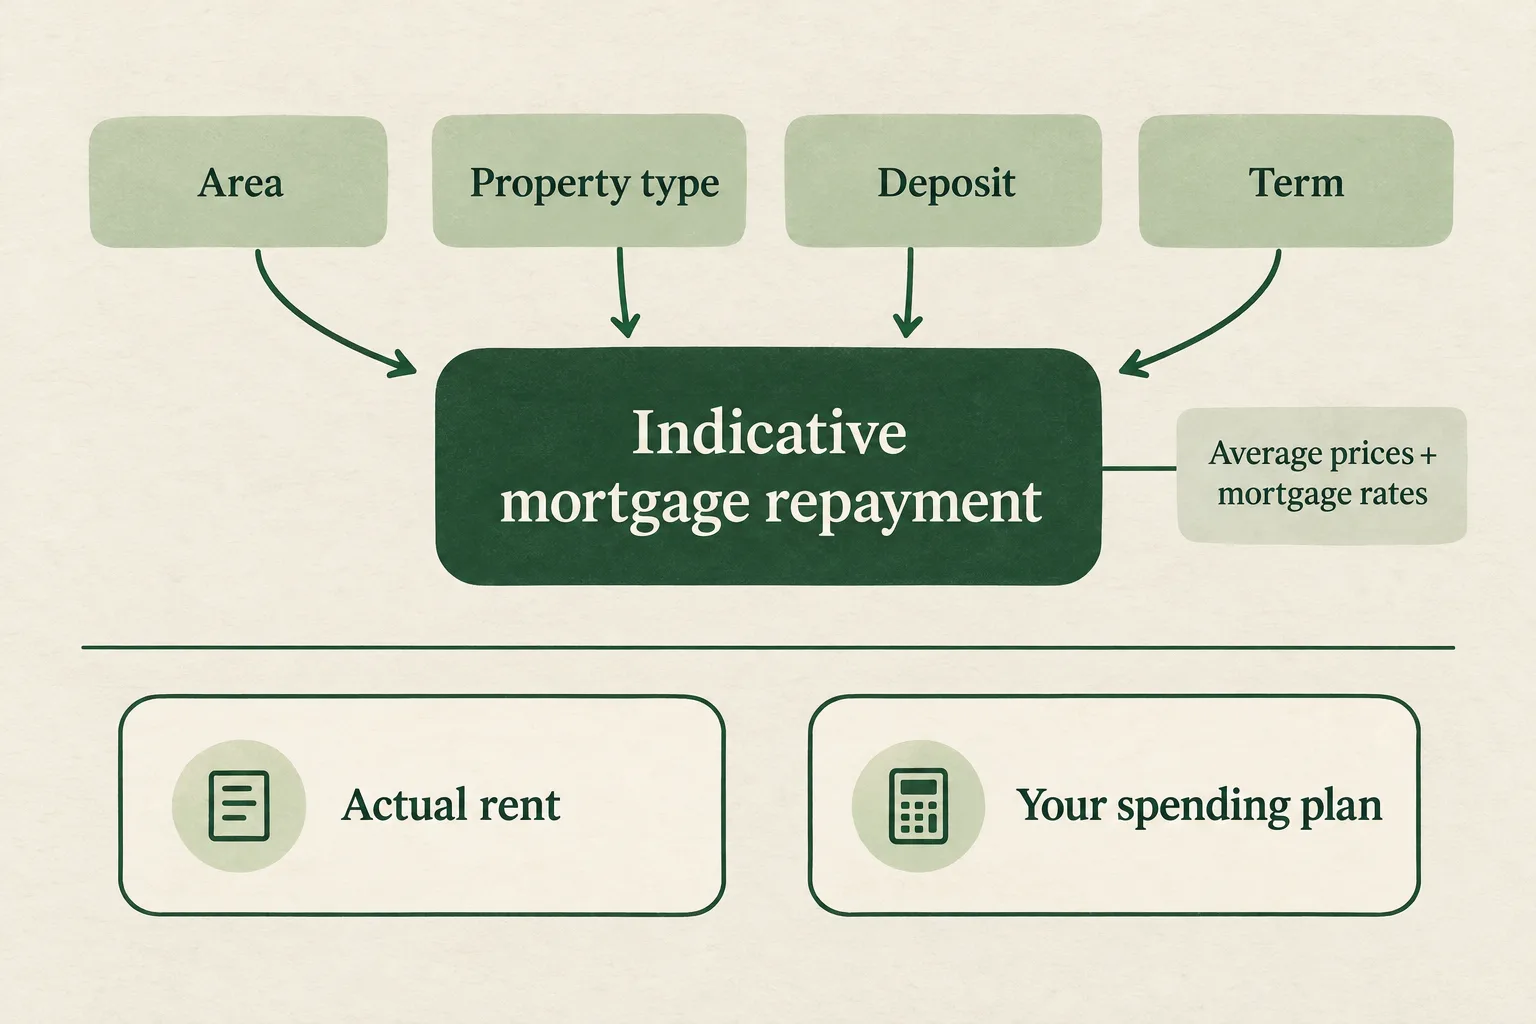
The calculator combines average property prices from the UK House Price Index with mortgage interest-rate data from the Bank of England. It estimates monthly repayments for someone purchasing a property at the average price for the selected area and property type, using their chosen deposit and mortgage term. The map covers England, Scotland and Wales, not Northern Ireland. Source: ONS
Users can select a detached house, semi-detached house, terrace, or flat and maisonette, and enter a mortgage term of up to 40 years. The documented calculation uses average quoted five-year fixed mortgage rates; the costs apply to the initial fixed-rate period. These are assumptions for an indicative calculation, not a personalised mortgage offer. Source: ONS
For renters, the useful question is therefore narrow: what indicative mortgage repayment does this model produce for this area, deposit and property type? Keep that separate from the broader question of whether you should move or buy.
It is not evidence that your rent must rise
If a landlord or agent refers to mortgage costs when discussing rent, do not treat an area-wide calculator result as a statement of that landlord’s actual expenses. The ONS tool models purchases at average prices and explicitly does not represent remortgaging costs. It therefore cannot establish the repayment on an existing landlord’s loan. Source: ONS
The supplied evidence also does not measure changes in rents, demonstrate that mortgage costs have been passed on to tenants, or explain the legal procedure for changing rent. No conclusion about a rent increase’s validity should be drawn from this source alone.
As a practical response, separate three questions:
- What is being proposed? Ask for the proposed rent, intended start date and explanation in writing.
- What supports the explanation? Distinguish a general mortgage-cost illustration from information about the particular property.
- What rules apply to your tenancy? Seek current, jurisdiction-specific guidance before deciding how to respond. This mortgage article is not evidence of those rules.
A worked example: understanding the deposit setting
The ONS gives an example of a £200,000 purchase with a £178,000 mortgage. The difference is a £22,000 deposit, and the loan-to-value ratio is 89%: £178,000 divided by £200,000, multiplied by 100. These are illustrative figures from the source, not current local prices or a borrowing recommendation. Source: ONS
The calculator uses mortgage-rate bands for 60%, 75%, 90% and 95% loan-to-value ratios, rounding up to the next applicable threshold. In that example, the model would use the 90% band. This matters because changing the deposit can change both the amount borrowed and the rate band used in the estimate. Source: ONS
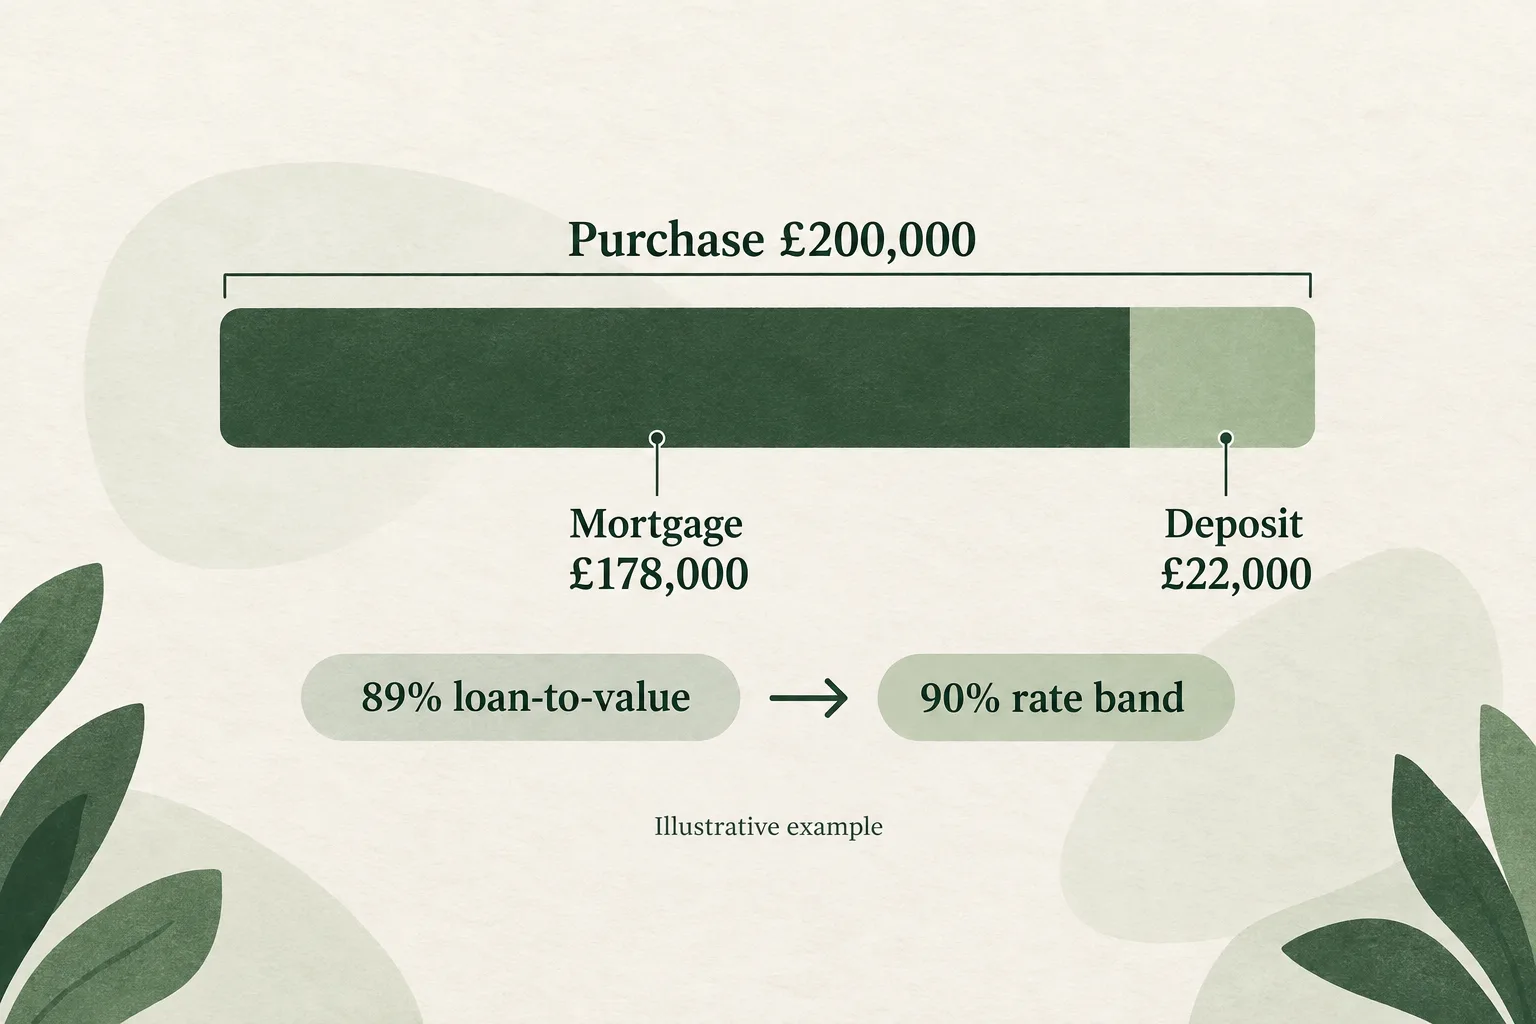 The source’s illustrative purchase: 89% loan-to-value rounds up to the 90% rate band. · AI-generated illustration
Use the example to understand the calculation—not to infer that you would qualify for a mortgage or receive that average rate.
A renter’s checklist for using the map
If you are exploring areas for a possible purchase, use a consistent set of inputs and keep a short comparison note:
- Record the property type, deposit and term you entered.
- Record the date of the figures shown, rather than just the date you opened the page.
- Compare areas using the same inputs before changing one assumption at a time.
- Label the result “indicative mortgage repayment”, not “total housing budget”.
- Keep your actual rent and your own spending plan in separate columns.
- Do not use the map to predict future rates or make a personal finance decision; ONS expressly warns against those uses and recommends independent financial advice when required. Source: ONS
For organising an area search, see /postcodes. If you are continuing to rent, keep your property assessment separate from mortgage estimates and use the rental viewing checklist.
Should an existing guide be updated?
Recommendation: check the tenant FAQ for a small clarification, rather than rewrite a rental guide around mortgage data. If /tenant-faq discusses landlords’ mortgage costs or explanations for rent increases, consider adding a note that this ONS purchase calculator does not establish an individual landlord’s repayments or a tenant’s legal position.
The existing guide text has not been supplied, so this is a proposed editorial check, not a confirmed omission. Any explanation of rent-increase rights needs fresh evidence for the relevant UK jurisdiction. The main takeaway remains simple: use the map to understand its purchase assumptions, not to justify rent changes or forecast your next housing bill.